Live Dashboard
A reporting dashboard that reads a live spreadsheet and redraws itself when the numbers move.
Capabilities used
- CRM & Automation Systems
- Analytics & Reporting Dashboards
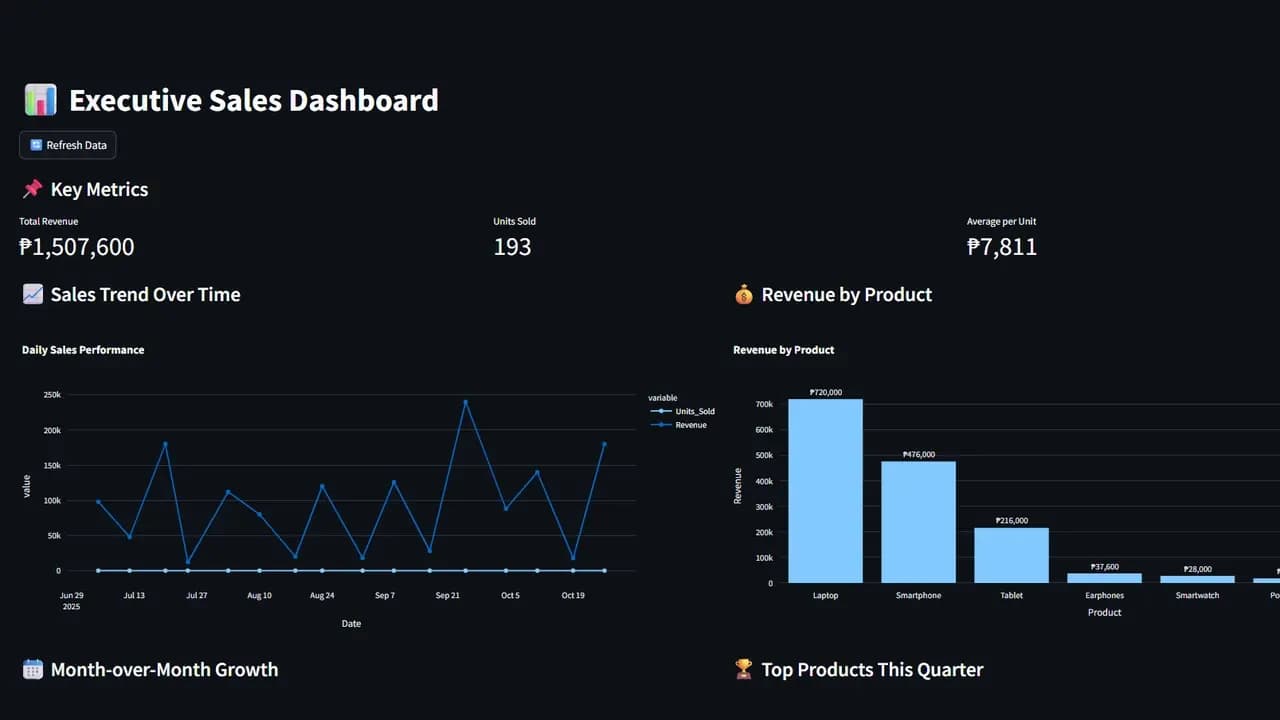
Three Numbers First
The page opens on total revenue, units sold and average per unit, set large and spread across one row above everything else. Nothing on the screen competes with them. Somebody who reads only the top of this dashboard has already been told how the period went.
Everything under that row exists to explain it. The trend line says when, the product bars say where, and the table at the bottom says what has just come in.
What It Reports On
The dashboard was made for reporting on GoHighLevel work: the funnels, the pipelines and the campaigns feeding them. That is the job it was drawn around, and it is why the row at the top is revenue rather than traffic.
In this build the live source is a spreadsheet, and GoHighLevel is the layer the thing was designed to sit on top of. The sheet stands in for it and does the same work.
Growth, Then the Quarter
Further down the same idea repeats at a longer range. Month over month growth comes first, one bar per month, so direction reads before any value does. Beside it sit the quarter's leading products.
Under both of them is a plain table of the most recent sales. Two charts and then the raw rows, which is the order somebody actually asks for them in.
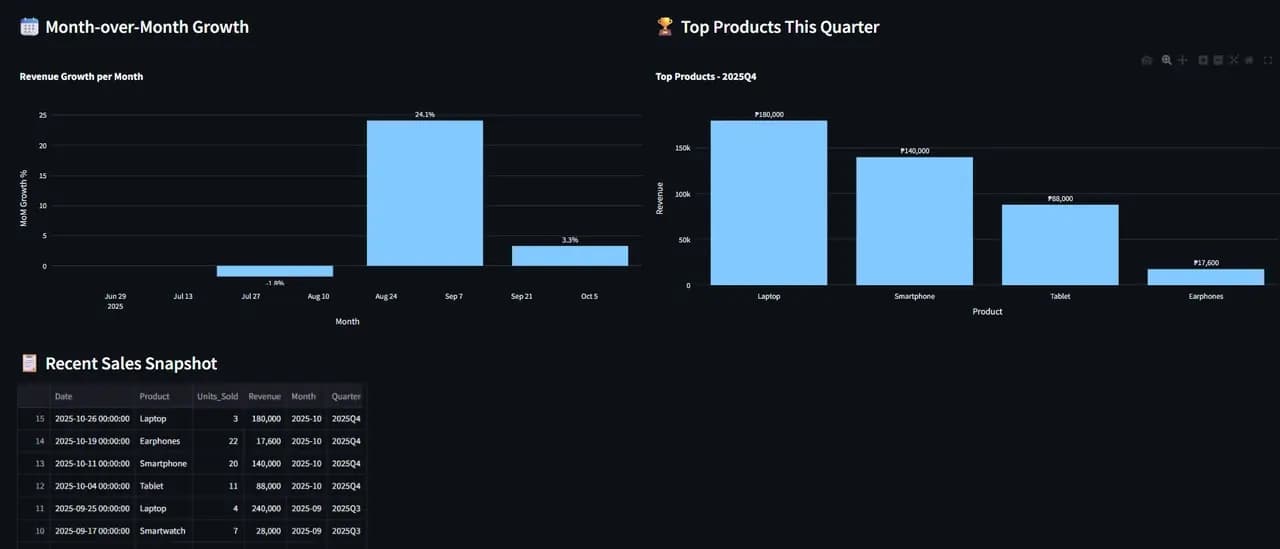
The Refresh Control
There is one control on the whole page and it says refresh. Press it and the dashboard reads the sheet again, then redraws every figure and every chart from whatever it finds there.
That is the design decision the rest of it rests on. Recording a sale means typing a row into a spreadsheet, so the report keeps working without anybody maintaining the report.
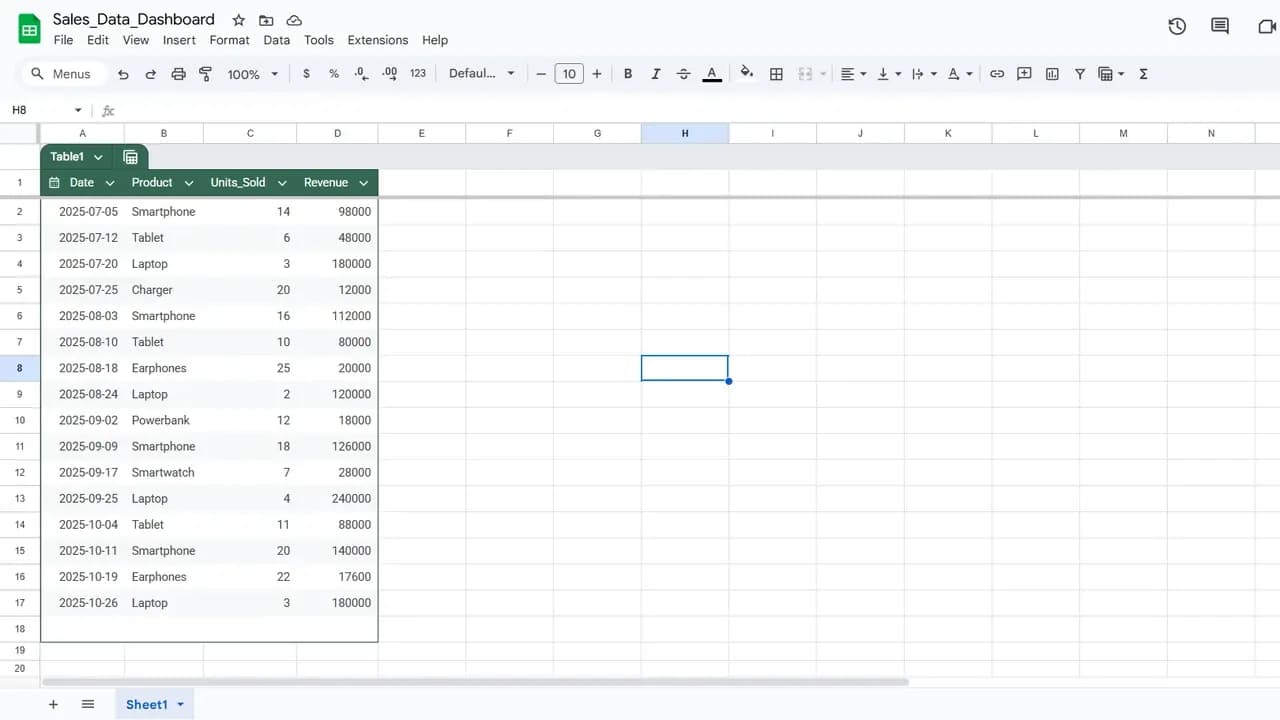
Python and a Spreadsheet
The dashboard is a Python program built with Streamlit and served from the machine it runs on. Its data lives in a Google Sheet, and its charts are drawn rather than pictured, so they can be read at any size.
A spreadsheet is an unglamorous place to keep the data and it is the right one here. Anybody can open it, anybody can add a line, and nothing has to be exported before the dashboard sees it.
The Sample Data
The sales in the sheet were written to fill the dashboard rather than recorded from a business. The products are generic and the figures are ours.
That is what a demonstration of a reporting tool needs. What is being shown here is the reporting, and putting somebody else's trading on a portfolio page would show something else entirely.
Not a Website
Everything else in this portfolio is a page you look at. This is a tool you read, and it is the one piece here whose job carries on after the design is finished.
It is also the only one where the design has to survive its own content changing under it. The layout was built for numbers nobody had seen yet, and that is the part of it worth keeping.
Keep exploring
Next project: Stephen ProcterWant something like this for your business?
Tell us what you're trying to grow, and we'll reply with a straight answer on whether and how we can help.